Workflows
Workflows: data pipelines you can see, test and hand over

Dominik Strasser
Co-Founder, dcupl
Most data pipelines live in scripts only one person understands. dcupl workflows make the pipeline a graph you can see: a trigger, nodes that fetch, transform and save, and edges that carry the data between them. You build it in the Console, run it against real data and deploy it to a runner, and the next person can read it.
workflows data integration automation
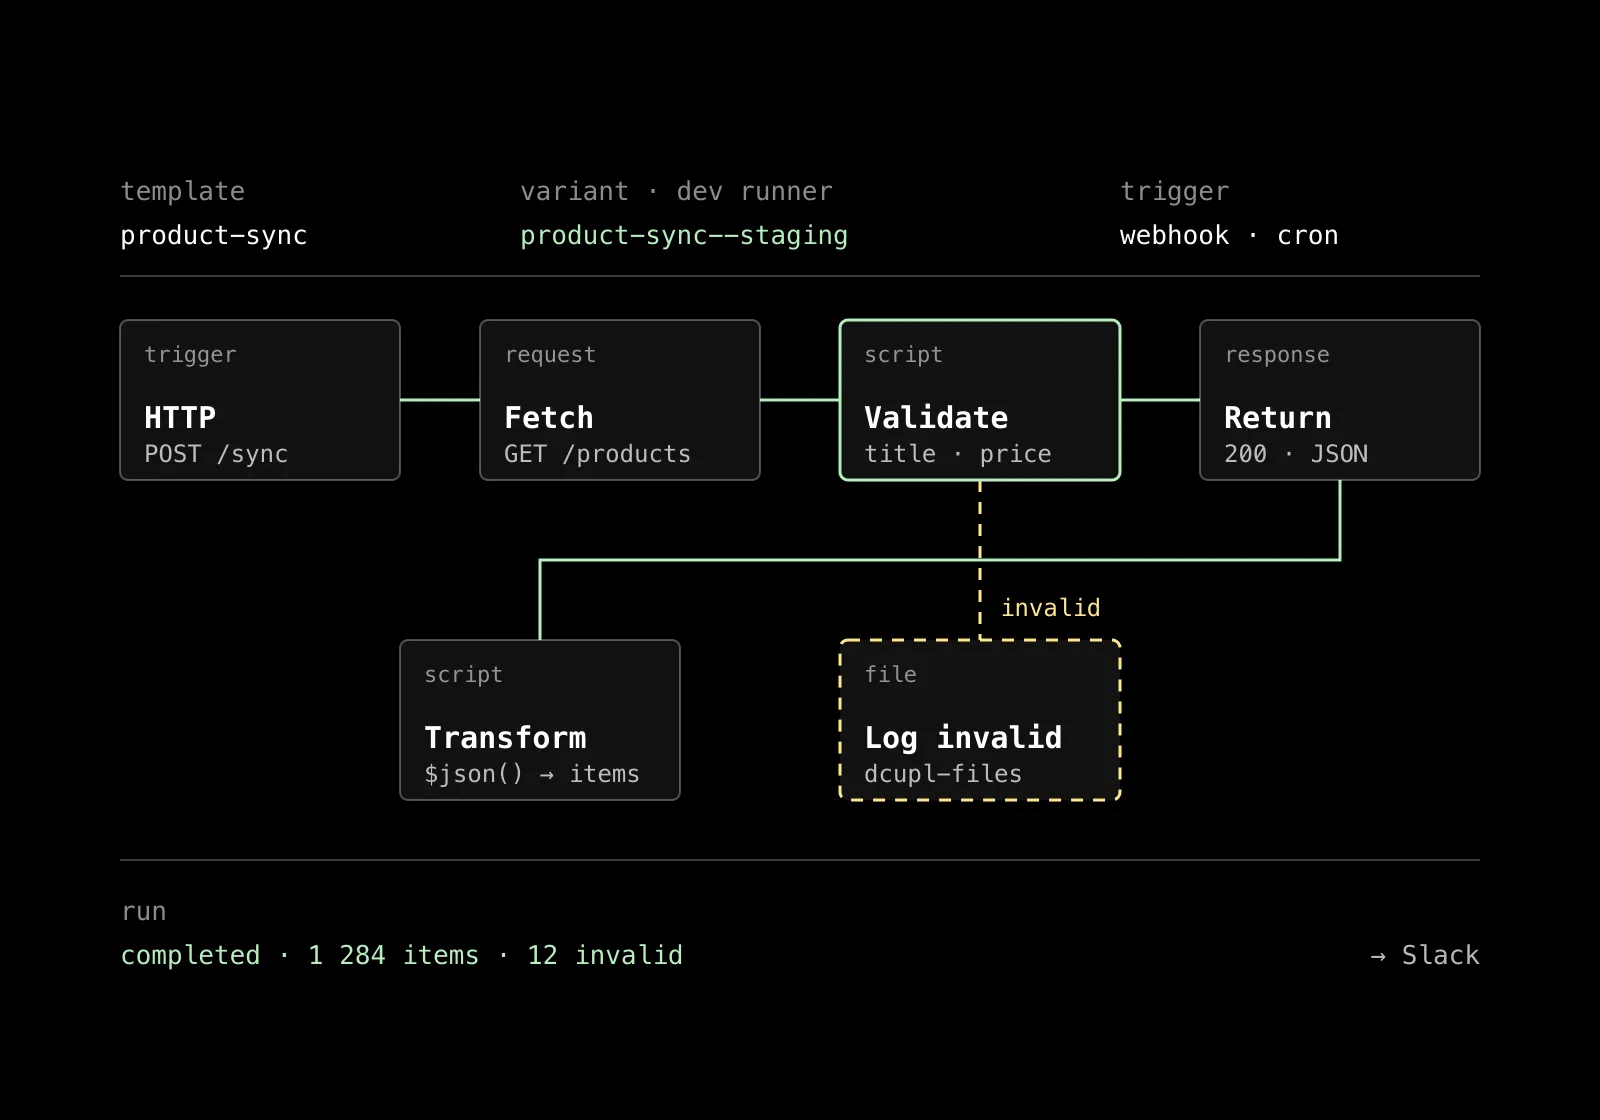
Every company we work with has one of these: a script that fetches the product export every night, cleans it up and pushes it somewhere. It works. Nobody touches it. The person who wrote it has moved on, the comments are out of date, and the one time it failed, it took a day to find out why.
That pipeline is not a technical problem. It is a visibility problem. The logic is fine. It is just invisible to everyone but its author.
A pipeline as a graph
A dcupl workflow is a directed graph. Data enters at a trigger, flows along edges through nodes, and leaves as a response, a file or an update of your dcupl data. Each node does one thing: a request node calls an external API, a script node transforms the items, a file node reads or writes to storage, a dcupl node queries or updates your models.
You build the graph in the Console's visual editor by dragging nodes from the palette and connecting their ports. The graph is also the documentation. A new colleague opens the workflow and sees what happens to the data, in which order, and where errors go.
Triggers: a webhook or a schedule
Every workflow starts with a trigger. An HTTP trigger gives the workflow an endpoint on the runner, with a path, allowed methods and optional API key authentication. A scheduled trigger runs on a cron expression in a timezone of your choice.
That covers the two cases we meet most often: the external system that wants to push data the moment something changes, and the nightly sync that should just run. To run a deployed workflow by hand, you click Execute in the editor.
Nodes that do one thing each
The request node makes HTTP calls. Variables such as an API token come from the workflow's variables, so the token is not written into the node itself. Success goes to the main port. A timeout, a client error and a server error each go to their own port, so the graph can treat them differently.
The script node runs JavaScript in an isolated sandbox. It reads the incoming items, returns the transformed ones and throws to route to the error port. It cannot make HTTP calls or touch the filesystem. That boundary is deliberate: outbound calls belong in request nodes and file access in file nodes, where they are visible in the graph.
The file nodes read and write files in dcupl cloud storage, in a Git repository, in S3 or in Azure Blob Storage. The data mapper renames and drops fields with a mapping table, or runs the items through a dcupl model definition. The dcupl instance node loads your project's data model and queries or updates it from inside the workflow.
Errors are part of the graph
In the script nobody touches, an error is a stack trace in a log file. In a workflow, an error is an edge. The request node routes a failed call to its error port, and you decide what happens next: log it, write the failed items to a file, call a fallback, or stop.
Reporting adds the part the log file never had. A reporting rule watches your deployed workflows for a failed run, a completed run or a recovery, and calls a reporting workflow that posts to Slack, to Teams or to any webhook. A scheduled digest mails or posts a daily or weekly summary of your runs. Only run metadata leaves the runner, never the items themselves.
Variants for staging, one template for production
A workflow key with a suffix such as product-sync--staging creates a variant of product-sync. The Templates tab shows the variant on its base template's card. You change the variant, deploy it to a dev runner, run it against real data and look at the result. When it is right, Promote to Base writes it over the production template. The deployed base keeps running the old version until you deploy it again.
This is how we want data changes to happen everywhere in dcupl: a step between the change and production that somebody can look at.
Where to start
The getting started guide builds a first workflow in the Console: a webhook trigger, a request to a sample API, a validation with a valid and an invalid branch, a transform and a response. The reference has the template format, the script globals and the limits. If your agent builds the workflow for you, the agentic recipes show how it authors, validates, tests and deploys one from the terminal.
The pipeline nobody dares to touch is a pipeline nobody can see. Make it a graph.